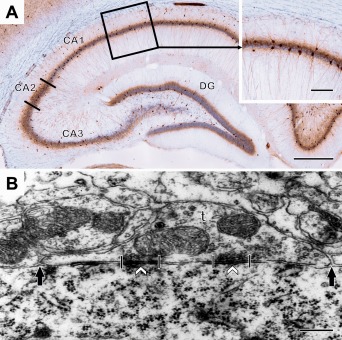
Figure 4.

A: A light microscopic image of a parvalbumin‐immunostained preparation from the dorsal hippocampus. DG is the dentate gyrus, CA1‐3 are regions of the Ammon's horn. Insert shows the outlined area of the CA1. This outlined area was used for the electron microscopic analysis. B: An electron micrograph of an axo‐somatic terminal (t) in the CA1 area. The opposing length of the axon terminal (between the solid arrows), synapse length (between the crossing lines) and synapse numbers (white arrowheads) were measured and counted to compare the morphological features of perisomatic contacts and inhibitory synapses in the stressed and control animals. Scale bars: 0.5 mm on A; 0.125 mm on A insert; 250 nm on B. [Color figure can be viewed at wileyonlinelibrary.com]
