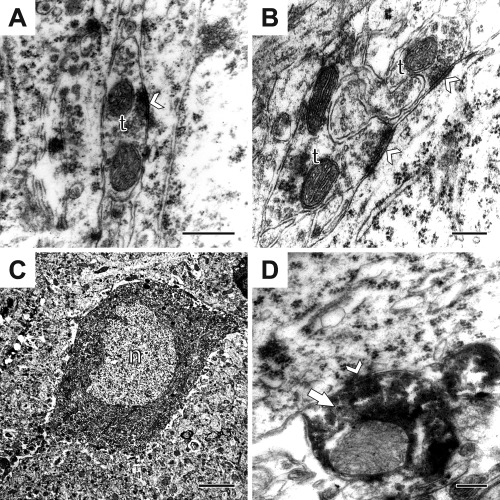
Figure 5.

Electron micrographs from control (A) and stressed rats (B). (A): An axon‐terminal (t) with an axo‐somatic synapse (white arrowhead) between two pyramidal neurons in the hippocampal CA1 region of a control rat. Occasionally such terminals formed synapses with both pyramidal cells. (B): Two axon‐terminals (t) opposing a pyramidal neuron in a stressed animal. Synapses are indicated by white arrowheads. (C): A parvalbumin‐positive neuron (n) inside the pyramidal layer of the CA1 showing the normal features as infolded nucleus and a large cytoplasm with abundant cytoplasmic organelles. (D): A parvalbumin‐positive axon‐terminal (white arrow) with an axo‐somatic synapse (white arrowhead). Scale bars: 400nm on A; 200nm on B; 5µm on C and 400nm on D. Abbreviations: axon‐terminal (t); nucleus (n).
