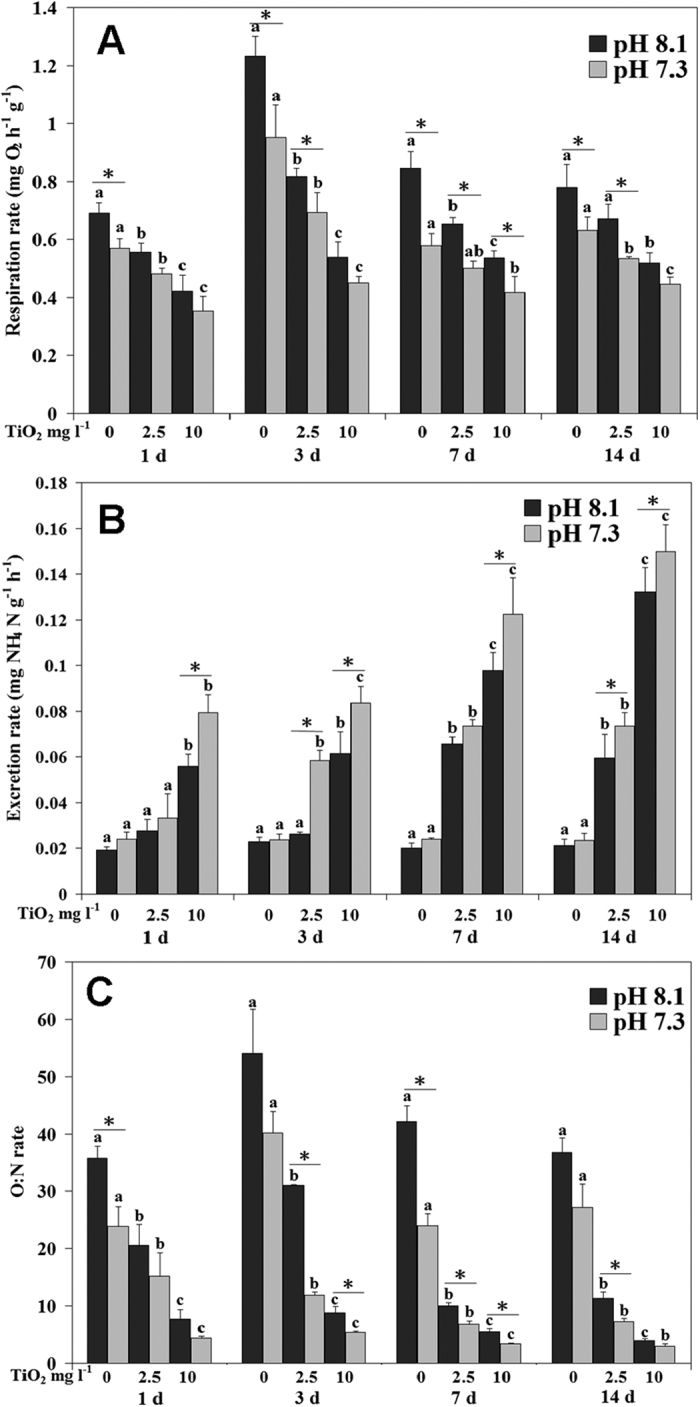
Figure 2.

Ammonia excretion rate (ER, A), Respiration rate (RR, B) and O:N ratio (C) of M. coruscus exposed to six treatments for 14 days. The values with different superscripts at pH are significantly different among three nano-TiO2 treatments (P < 0.05). The values denoted by an asterisk between two pH groups at each nano-TiO2 concentration are significantly different (P < 0.05).
