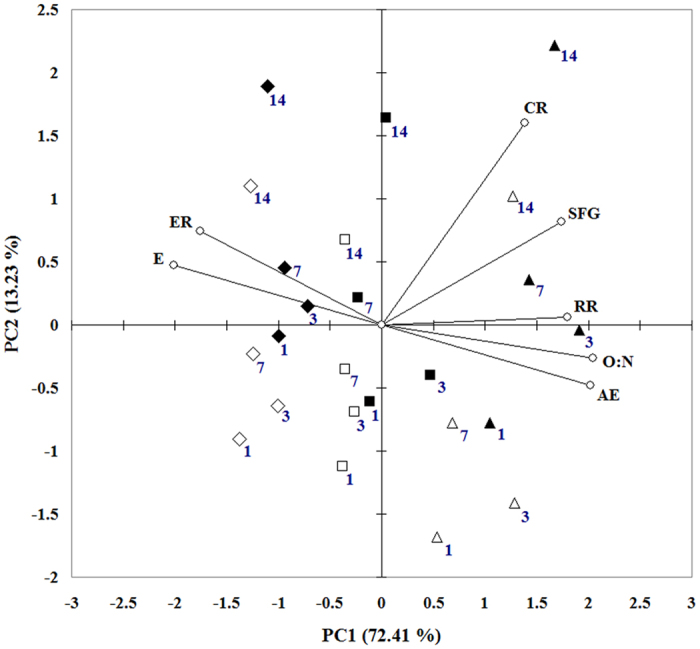
Figure 4. Principal component analysis (PCA) by integrating all measured parameters (CR, AE, RR, ER, O:N, SFG, E) for four times (days: 1, 3, 7 and 14) and six different treatments (▴–TiO2 0 × pH 8.1, △–TiO2 0 × pH 7.3, ▪–TiO2 2.5 × pH 8.1, ▫–TiO22.5 × pH 7.3, ♦–TiO210 × pH 8.1, ◊–TiO2 10 × pH 7.3) with a biplot.

Both the scores of the experimental conditions and the loadings of the parameters (○) were present.
