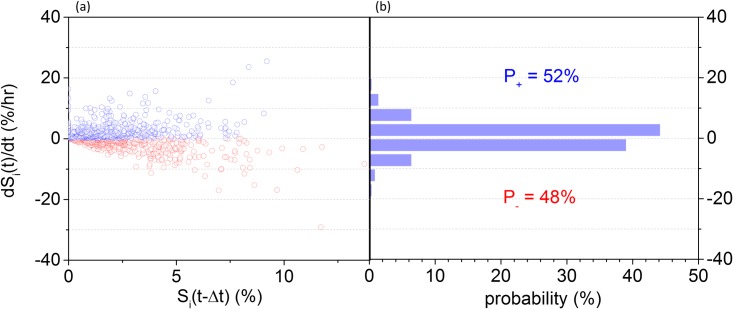
Fig 2.
(a) A scatter plot of the lipid flux (dSi(t)/dt) as a function of the total lipid content (Si(t-Δt)); each point represents the instantaneous flux per cell, with positive ones plotted in blue, and negative in red. (b) A probability histogram of the lipid flux for all observations (n = 80 cells).

