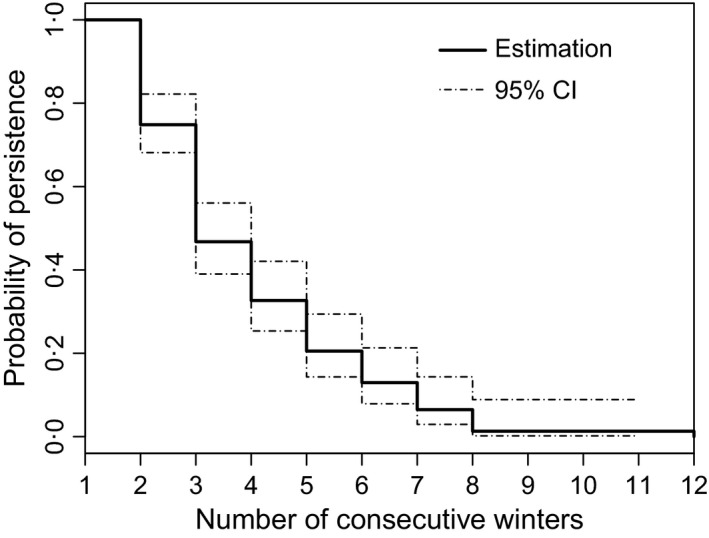
Figure 3.

Kaplan–Meier cumulative survival curve with 95% confidence intervals showing the probability of wolf pair bond persistence in Scandinavia during the winters 1998/1999–2011/2012. On the x‐axis, winter 1 shows the first winter a pair was detected, winter 2 the second and so on.
