
Figure 6.
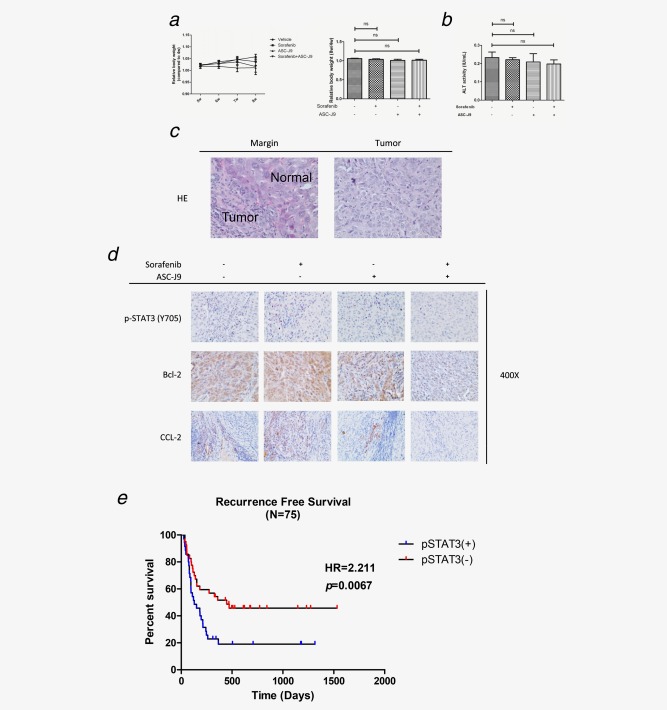
(a) Mouse body weights were measured once a week starting one month after xenografts. The relative body weight of each individual mouse was normalized to the body weight of 4 weeks. (b) The serum ALT activity (IU/ml) of each mouse before sacrificed was measured by ALT Colorimetric Activity Assay. (c) Representative HE staining images showing the xenografts tumor margin and tumor. (d) Representative images of IHC staining for p‐STAT3 (Y705), Bcl‐2 and CCL2 in different treatment groups. (e) Recurrence‐free survival curve of HCC patients who received Sorafenib treatment. The expression of pSTAT3 was assessed semiquantitatively as follows: negative (−) <5%, 5–25% (+, weak positive), 25–50% (++, positive) and >50% (+++, strong positive). Negative and weakly positive expression were defined as low expression, while positive and strong positive expression were defined as high expression. p < 0.05 was considered statistically significant. *p < 0.05, **p < 0.01 and ***p < 0.005.