
Figure 3.
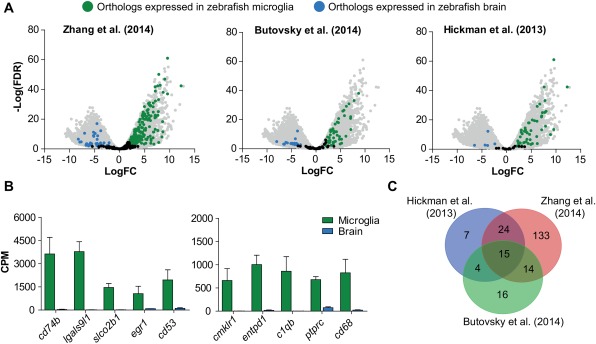
Conserved microglia gene expression in the zebrafish. (A) Volcano plot showing expression of zebrafish orthologs of genes found to be enriched in microglia compared with Zhang et al. (2014), Butovsky et al. (2014), and Hickman et al. (2013), respectively. All zebrafish genes are shown in grey. Differentially expressed orthologs (FDR <0.01, LogFC > |2|) are shown in green (microglia) or blue (other brain cells). (B) Expression values (CPM) of orthologs for genes found by one or more of the above mentioned studies. (C) Venn diagram showing overlap of microglia‐specific orthologs of genes found in three transcriptomic studies (Butovsky et al., 2014; Hickman et al., 2013; Zhang et al., 2014). Values in (B) represent means of three independent experiments; Error bars in (B) represent standard deviation.