
Figure 5.
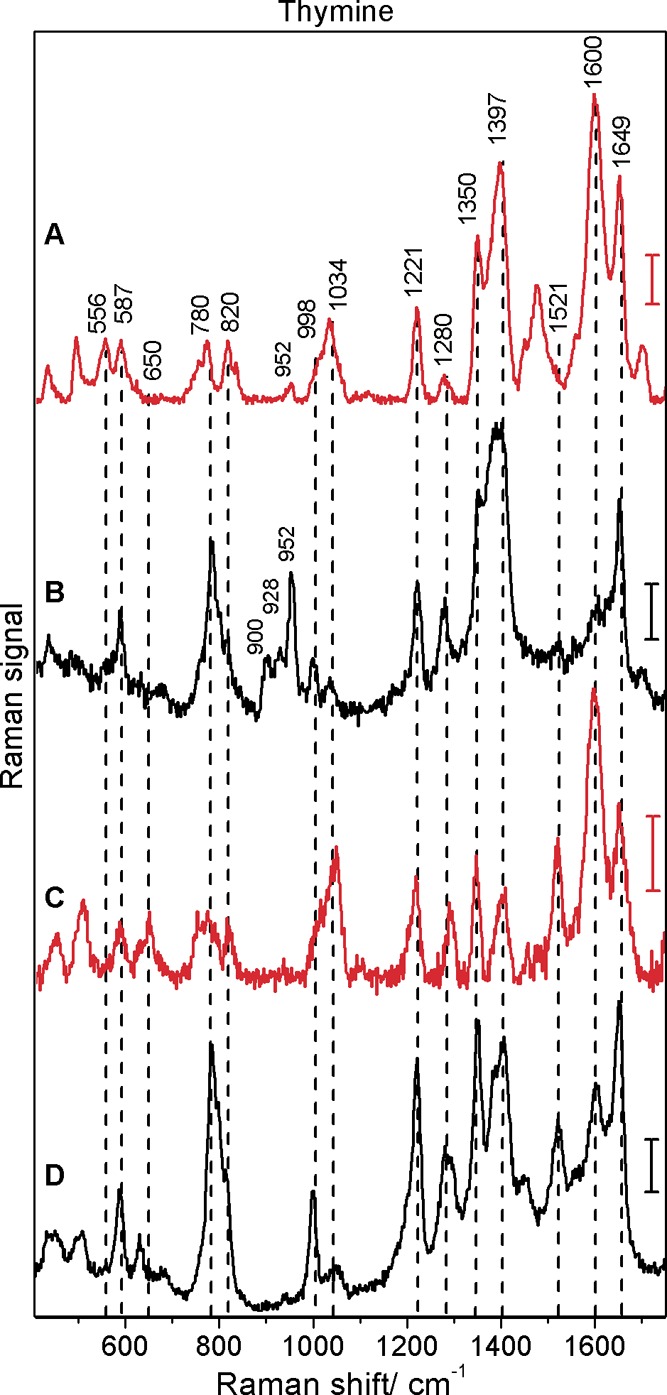
Surface-enhanced hyper-Raman (A, C) and surface-enhanced Raman (B, D) spectra of thymine obtained with citrate (A, B) and hydroxylamine (C, D) reduced silver nanoparticles: excitation, 1064 nm (A, C) and 532 nm (B, D); photon flux density, 1.7 × 1028 photons cm–2 s–1 (A, C) and 1.4 × 1027 photons cm–2 s–1 (B, D); acquisition time, 40 s (A), 100 s (C), and 1 s (B, D); scale bars, 5 cps (A), 300 cps (B), 1 cps (C), and 600 cps (D); thymine concentration, 5 × 10⁻⁵ M. Spectra with hydroxylamine reduced silver nanoparticles were obtained at pH 10.