
Figure 4. Molecular docking between KBA 3-1 and kanamycin.
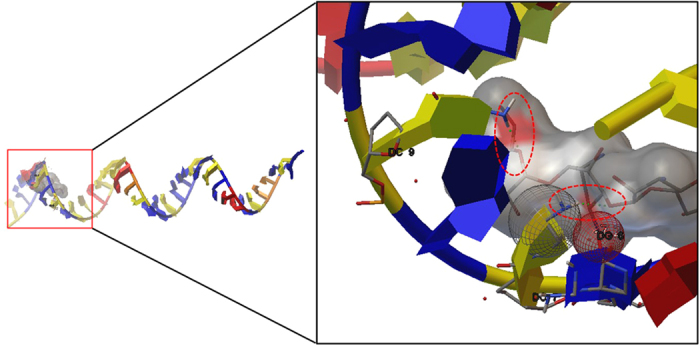
The hydrogen bonds between KBA 3-1 and kanamycin are indicated by red circles. The hydrophobic interaction patch is indicated by the gray sphere. The red sphere indicates ionic interaction of hydroxyl groups.