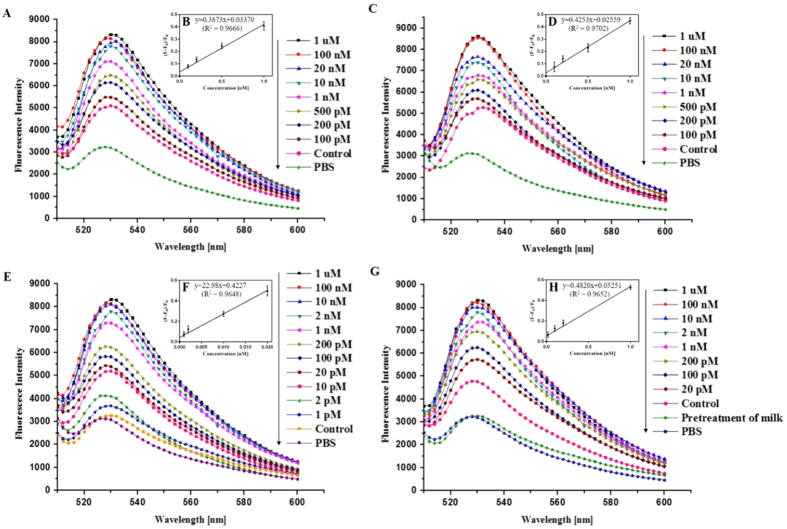
Figure 6. Detection of kanamycin in various real samples using the RGO-based fluorescent aptasensor system.
Fluorescence spectra of 100 nM FAM-labeled KBA 3-1 and 0.1 mg/mL of RGO in (A) bovine serum (BS) and (C) rabbit serum (RS) containing various concentrations of kanamycin (100 pM–1 μM). (B,D) Peak fluorescence change shows a linear relationship with kanamycin concentration from 100 pM to 1 nM. (E) Fluorescence spectrum of 100 nM FAM-labeled KBA 3-1 and 0.1 mg/mL of RGO with pretreatment of milk containing various concentrations of kanamycin (1 pM–1 μM). (F) Peak fluorescence change shows a linear relationship with kanamycin concentration from 1 to 20 pM. (G) Fluorescence spectrum of 100 nM FAM-labeled KBA 3-1 and 0.1 mg/mL of RGO in real milk containing various concentrations of kanamycin (20 pM–1 μM). (F) Peak fluorescence change shows a linear relationship with kanamycin concentration from 20 pM to 1 nM.

