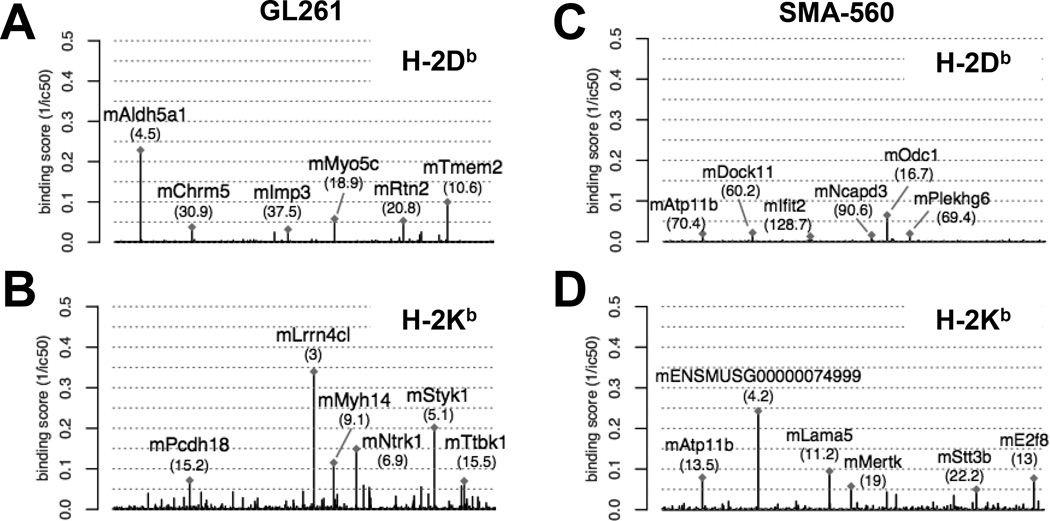
Fig. 2.
Neoantigen landscape of GL261 and SMA-560. Manhattan plot of mean binding affinity (1/ic50) of putative candidate GL261-derived neoantigens for H-2Db (a) and H-2Kb (b). Manhattan plot of mean binding affinity (1/ic50) of putative candidate SMA-560-derived neoantigens for H-2Db (c) and H-2Kb (d). Labeled are the six highest predicted binding affinity candidate neoantigens. Numbers in parentheses represent calculated ic50 (nM) for each candidate neoantigen.

