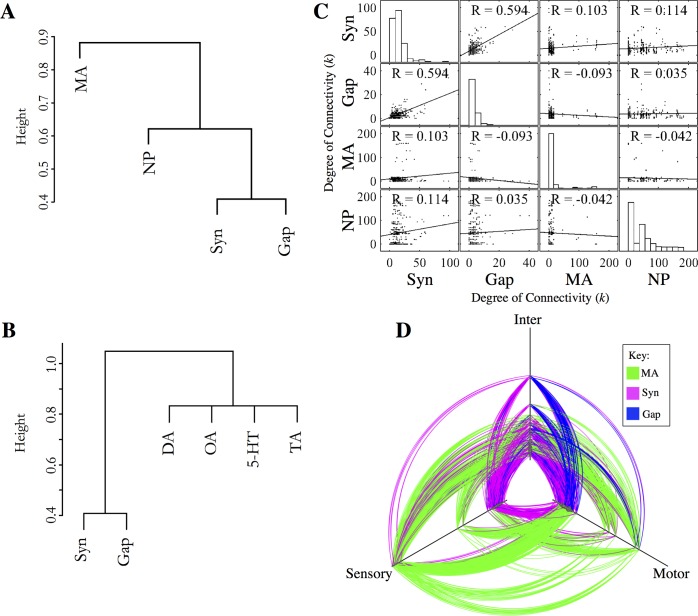
Fig 3. Monoamine networks are largely non-overlapping with the wired connectome.
(A-B) Multilayer reducibility dendrograms. Panel A considers monoamine and neuropeptide networks in aggregate; panel B considers monoamine systems individually with neuropeptide systems not included. Layers close on the dendrogram have more overlapping edges and are more reducible. Branching height gives the Jensen-Shannon distance between the layers. (C) Degree-degree correlation matrix. Off-diagonal panels show the degree-degree correlation between a pair of network layers. Panels on the diagonal show the degree distribution of the individual layers. Monoamine hubs correspond to releasing neurons, which are distinct for each monoamine. (D) Hive plot showing the wired synaptic (magenta), gap junction (blue), and monoamine connections (green). Nodes are classified as sensory, motor or interneurons and are arranged along the three axes according to their degree. Hubs are located further out along the axes.

