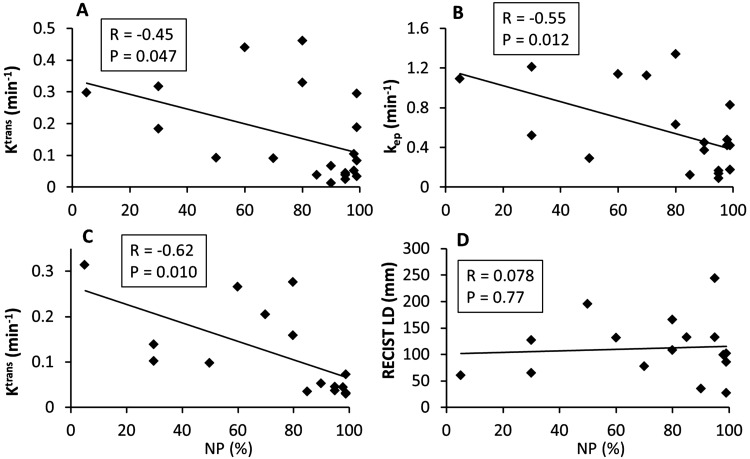
Figure 2.
Scatter plots of pathologically measured necrosis percentage (NP) of the resection specimen against Ktrans (A) and kep (B) before therapy (V1) and Ktrans (C) and RECIST LD (D) after 2 weeks of sorafenib administration or 1 chemotherapy cycle (V2). The straight line in each panel represents a linear regression. The Pearson correlation coefficient, R, and P values for the 4 imaging metrics are listed in Table 3 and shown in each panel. The data points are from the initial cohort of 20 patients for the V1 metrics (A and B) and the 16 patients who continued to have the V2 MRI studies (C and D).

