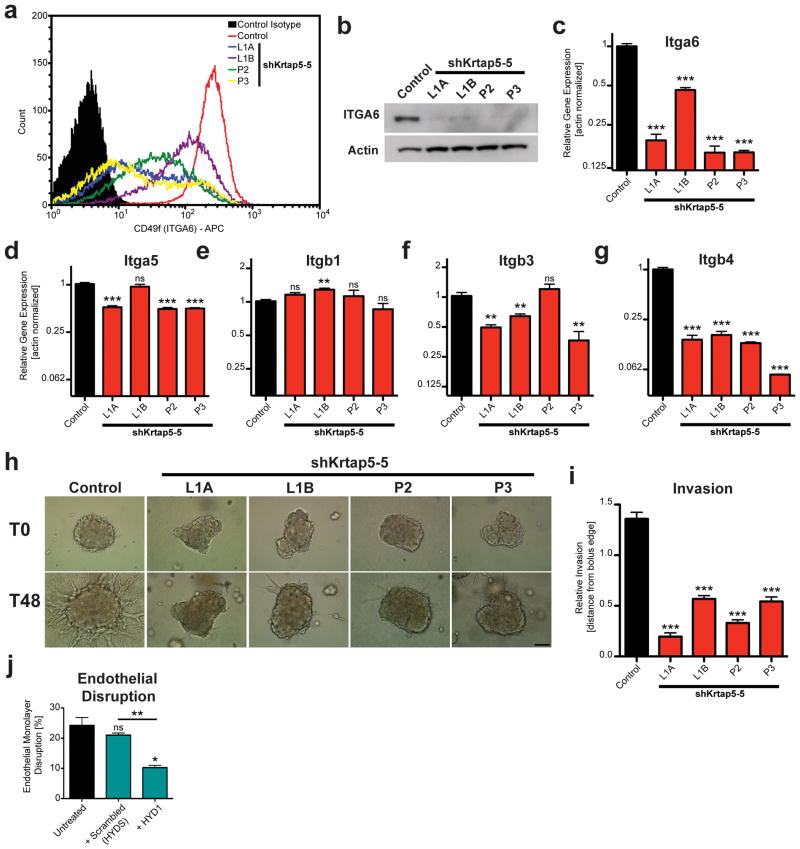
Figure 4.
Krtap5-5 stabilizes hemidesmosomal integrins and permits cell invasion. (a–c) α6-integrin (ITGA6, CD49f) expression in control and Krtap5-5 knockdown cells. Flow cytometry for cell surface protein (a), total protein by Western blot (b), mRNA expression (c); ** p<0.01, *** p<0.001, mean ± SEM. (d–g) mRNA expression of α5-integrin (d), β1-integrin (e), β3-integrin (f), and β4-integrin (g); ** p<0.01, *** p<0.001, mean ± SEM. (h, i) Cell invasion of control and Krtap5-5 knockdown cells from a spheroid into a 3D matrix consisting of Matrigel and type I collagen. (h) Representative images at 0 and 48 hours. Scale bar, 100 μm. (i). Quantitation of cell invasion. *** p<0.001, versus control; mean ± SEM; boluses quantitated: n= Control (49), L1A (41), L1B (47), P2 (34), P3 (38). (j) Endothelial monolayer disruption by E0771 cells treated with a α6/β4-integrin peptide blocker (HYD1) vs scrambled peptide (HYDS) after 15 hours. ns, not significant vs control; * p<0.05, ** p<0.01, mean ± SEM.

