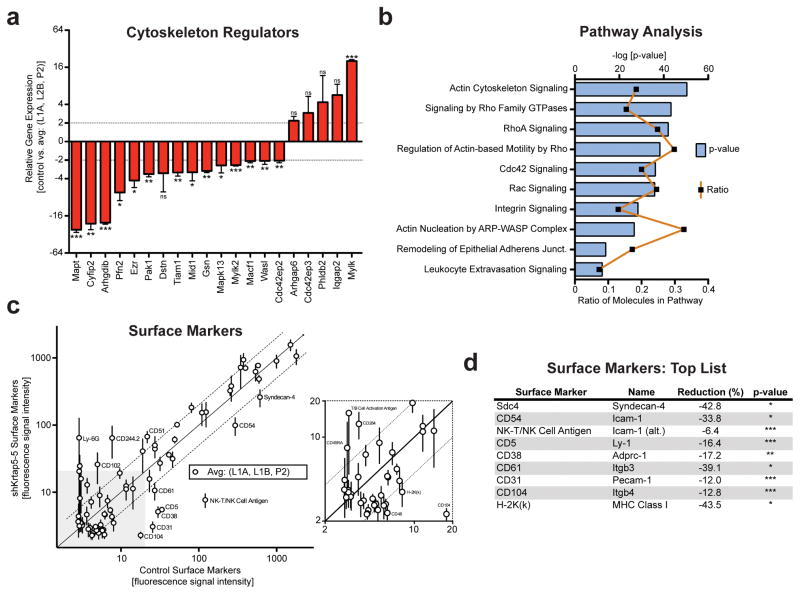
Figure 6.
Manipulating the level of Krtap5-5 broadly impacts on cytoskeleton regulators and cell surface proteins. (a) mRNA profile of cytoskeleton regulators exhibiting >2-fold change. Average of Krtap5-5 knockdown lines (L1A, L1B, P2) vs control. * p <0.5, ** p<0.01, *** p<0.001, mean ± SEM. (b) Pathway analysis (Ingenuity) using the entire cytoskeleton regulator panel after knockdown of Krtap5-5. The most impacted pathways are shown arranged by the p-value (log 10). The ratio depicts the number of molecules affected in the respective pathway. (c, d) Flow cytometry surface protein screen of 72 surface proteins in Krtap5-5 knockdown lines (L1A, L1B, P2) vs control. Averaged data (c) and top hits after statistical analysis (d) are shown. A 2-fold cutoff is denoted by dashed lines; surface proteins residing outside the cutoff are labeled. * p<0.05, ** p<0.01, *** P<0.001 versus control.

