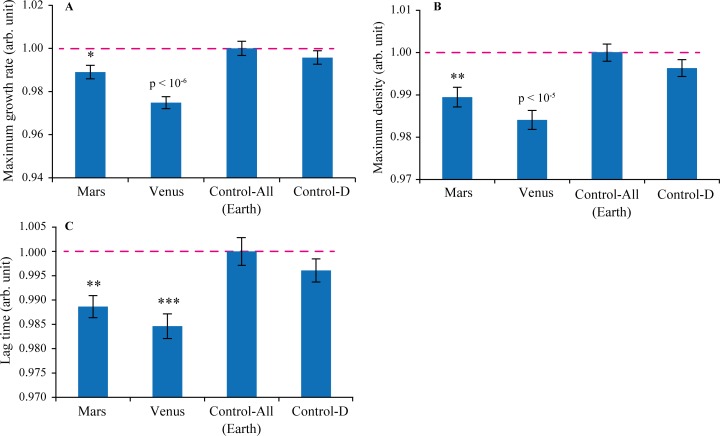
Fig 1. The results of E. coli growth parameter measurements at 25°C summarizing two independent experiments, each on a separate 100-well plate.
(A) Maximum growth rate. (B) Maximum density. (C) Lag time. Usually, more advantageous growth conditions result in faster growth, higher maximum density and shorter lag time.

