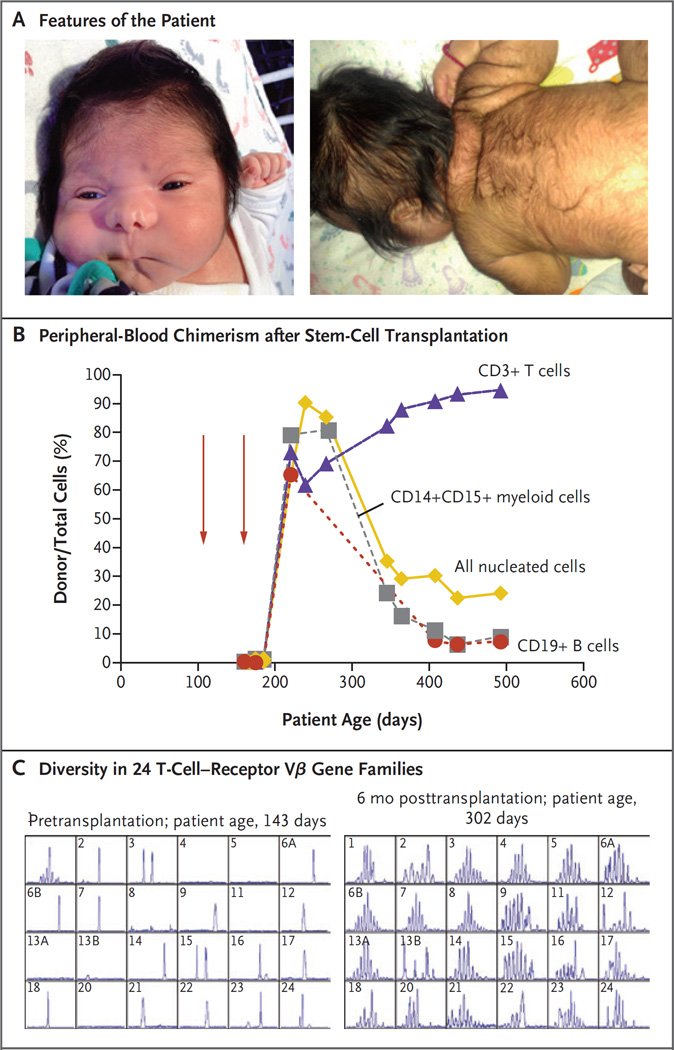
Figure 1. Clinical Findings.
Panel A shows the features of the patient (shown with informed consent). The image on the left shows increased intraorbital distance, short palpebral fissures, abnormal nasal creases, and micrognathia; the image on the right shows ear tag, loose skin folds, and hirsutism. Panel B shows the percentage of peripheral-blood chimerism after infusions of hematopoietic stem cells (red arrows) from a matched unrelated donor. Chimerism has been stable for more than 2 years. Panel C shows T-cell–receptor diversity measured by spectratyping before and 6 months after hematopoietic stem-cell transplantation. Numbers in the upper left of each panel indicate the specific T-cell–receptor Vβ gene family analyzed.

