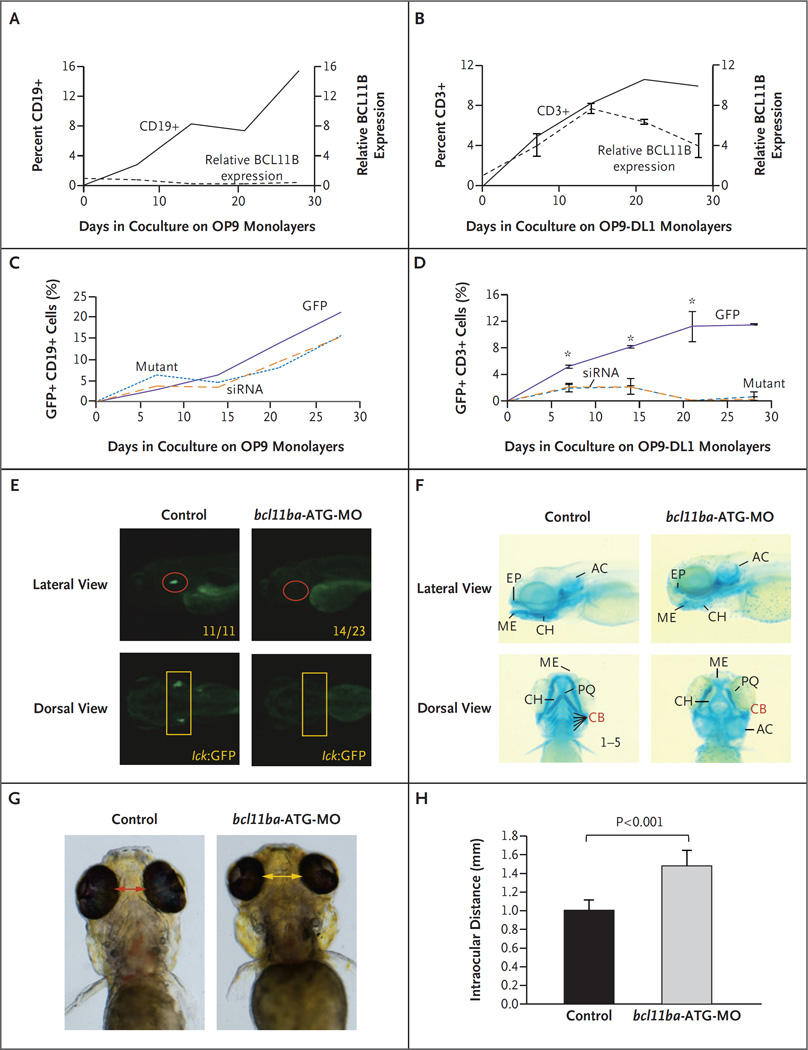
Figure 2 (facing page). Role of BCL11B in Human Hematopoietic Stem Cells and Zebrafish Development.
Panels A and B show lymphocyte frequency (left axis, solid lines) and BCL11B messenger RNA (mRNA) expression relative to that of housekeeping gene GAPDH (right axis, dashed lines) during in vitro differentiation of CD34+ human cord-blood cells cultured on the indicated OP9 monolayers. I bars indicate standard deviations. Panels C and D show differentiation of CD34+ human cord-blood cells transduced with green fluorescent protein (GFP) alone, mutant BCL11B–GFP, or BCL11B small interfering RNA (siRNA)–GFP lentivirus. Panel C shows the percentage of CD19+ B cells developing on OP9 monolayers, and Panel D shows the percentage of CD3+ T cells on OP9-DL1 monolayers. An asterisk indicates P<0.05. Panel E shows the effect of morpholino (bcl11ba-ATG-MO; see Fig. S4 in the Supplementary Appendix) knockdown of bcl11ba on T cell development at 5 days after fertilization in transgenic lck:GFP zebrafish embryos. Numbers in the lateral view are the fractions of embryos that have the depicted phenotype. Panel F shows the craniofacial cartilage of control versus bcl11ba morphant zebrafish embryos that were assessed at 5 days after fertilization by Alcian blue staining of craniofacial cartilage structures: AC denotes auditory capsular, CB ceratobranchial, CH ceratohyal, EP ethmoid plate, ME Meckel’s cartilage, and PQ palatoquadrate. Dorsal and lateral views are depicted. Panel G shows measurements of the distance between the eyes, and Panel H shows the distances depicted graphically as the mean for five embryos of each type; T bars indicate standard deviations.

