Fig. 2.
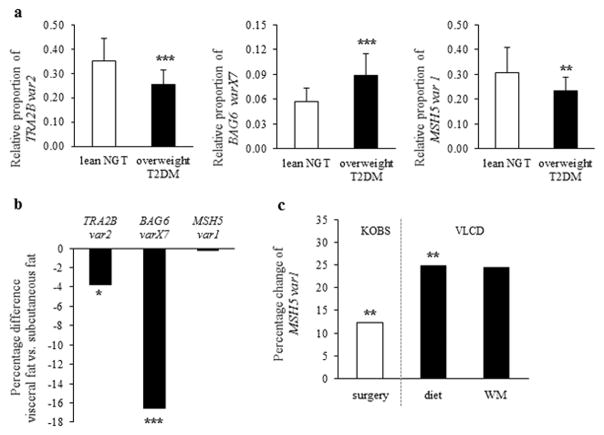
(a) The relative proportion of TRA2B var2, BAG6 varX7 and MSH5 var1 in the subcutaneous fat of lean normoglycemic individuals (white bars, lean NGT) and overweight type 2 diabetic (black bars, overweight T2DM) individuals in the METSIM study. Mean±SD shown. Comparison made using t- test. (b) Difference in expression levels of TRA2B, BAG6 and MSH5 splice variants between subcutaneous fat and visceral fat in the KOBS study. Comparison made using paired t- test. Total gene expression of TRA2B, BAG6 and MSH5 did not differ between fat depots (data not shown) (c) Change in expression level of MSH5 var1 during the year after gastric bypass surgery (white bar, KOBS study) and during a 7 week very low calorie diet followed by a 24-week weight-maintenance (WM) period (black bar, VLCD study) in subcutaneous fat. Comparison made using paired t- test. *p< 0.05, **p< 0.01, ***p<0.001. No change in total gene expression of TRA2B, BAG6 and MSH5 was detected in response to weight loss (data not shown).

