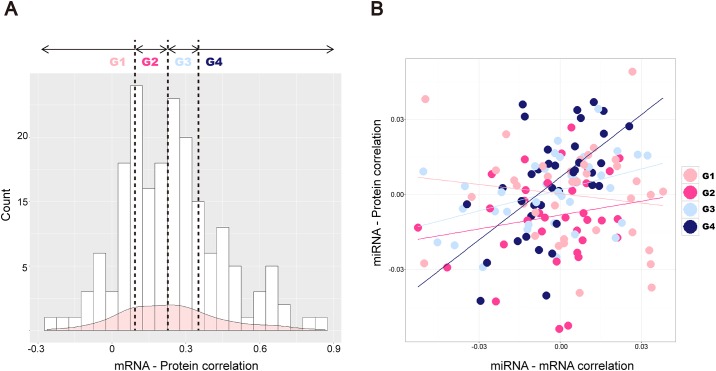
Fig 2. Comparison of mRNA and protein expression levels.
(A) Correlations between mRNA-protein expression levels are presented. On the x-axis, correlation coefficients for 146 common genes are shown, while the y-axis presents the frequency of SCCs. Vertical lines present 25th, 50th, and 75th percentiles of the SCCs. (B) On the x-axis, correlation coefficients between mRNAs and miRNAs are presented, and on the y-axis correlation coefficients between mRNAs and proteins are presented. Each dot represents one gene, and light pink, pink, light blue, and blue colored dots represent genes in G1, G2, G3, and G4 groups, respectively. Regression lines show relationships between mRNA-miRNA correlations and protein-miRNA correlations.

