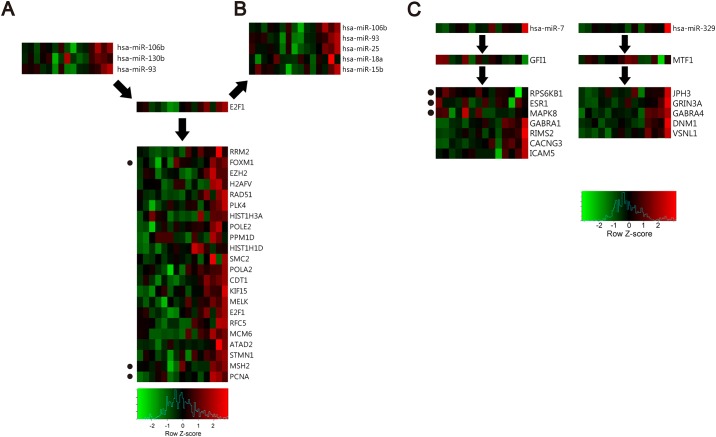
Fig 7. Heatmaps showing the regulation patterns of TF, miRNA, and selected gene and expression levels of the molecules included in modules 22 and 50.
(A-C) Red and green boxes show relatively high or low expression levels, respectively, of miRNAs, TFs, mRNAs, and proteins included in these modules, in each sample. The proteins are marked with dots on the left. (A-B) Heatmaps showing indirect TF-mediated regulation of genes, and co-regulation of miRNAs and genes by TFs, in module 22. (C) Heatmaps showing indirect TF-mediated gene regulation in module 50.

