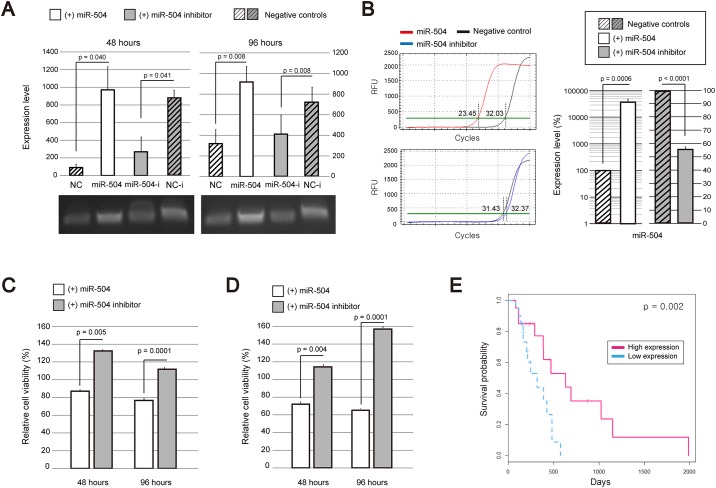
Fig 8. Effects of miR-504 on GBM cell viability and proliferation.
(A) Expression levels of miR-504 in non-transfected and transfected cells by miR-504 or miR-504 inhibitor, determined 48 and 96 h after the transfection by RT-PCR. NC, negative control cells not transfected with miR-504; NC-i, negative control cells transfected with miR-504 but without miR-504 inhibitor transfection. The averages of three indented experiments performed in triplicates are presented, with the error bars representing standard errors. Images showing the expression of miR-504 are presented under the plots. p-values were calculated using a two-tailed t-test. (B) MiR-504 expression levels following the transfection of cells with miR-504 or miR-504 inhibitor determined by q-PCR. The averages of three indented experiments performed in triplicates are presented, with the error bars representing standard errors. The graphs on the left side show the results from one of the experiments. The number of relative fluorescence units (RFU) according to the number of amplification cycles is presented with the thresholds. Red line shows the results of miR-504 transfected cells while the blue line shows the results of miR-504 inhibitor transfected cells. Negative controls are presented with black lines. The number of cycles that meets the amplification threshold for each case is presented. Bar graphs on the right side shows a relative expression level of miR-504 in the cells that are transfected with miR-504 or miR-504 inhibitor compared with that in the negative control cells without transfection. P-values were calculated using a two-tailed t-test. (C-D) Viability and proliferation rates of GBM cells transfected with miR-504 or miR-504 inhibitor were determined at 48 and 96 h after the transfection. (C) The results of three independent EZ-cytox assays performed in triplicate were averaged, and error bars representing standard error are shown. P-values were calculated by using two-tailed t-tests. (D) The results of three independent MTT assays performed in triplicate were averaged, and error bars representing standard error are shown. P-values were calculated by using two-tailed t-tests. (E) The analysis of miR-504 effects on the survival time of GBM patients. Red dotted lines and blue solid lines show overall survival time of GBM patients with high and low miR-504 expression levels, respectively.

