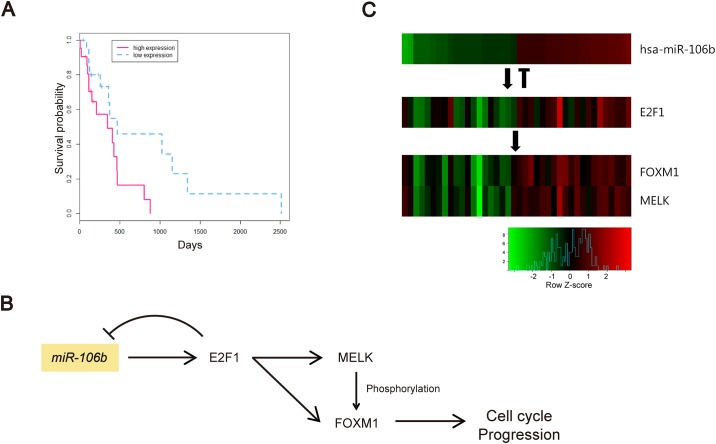
Fig 9. miR-106b-regulated genes in GBM.
(A) Survival time of GBM patients depending on miR-106b expression. Red dotted and blue solid lines represent GBM patients with high and low miR-106b expression levels, respectively. (B) The hypothesized model of miR-106b-induced cell cycle progression, through the regulation of E2F1, MELK, and FOXM1. Arrows indicate experimentally validated direct or indirect regulations. (C) Heatmap of miR-106b, E2F1, FOXM1, and MELK expression levels. Red and green indicate high and low expression levels, respectively.

