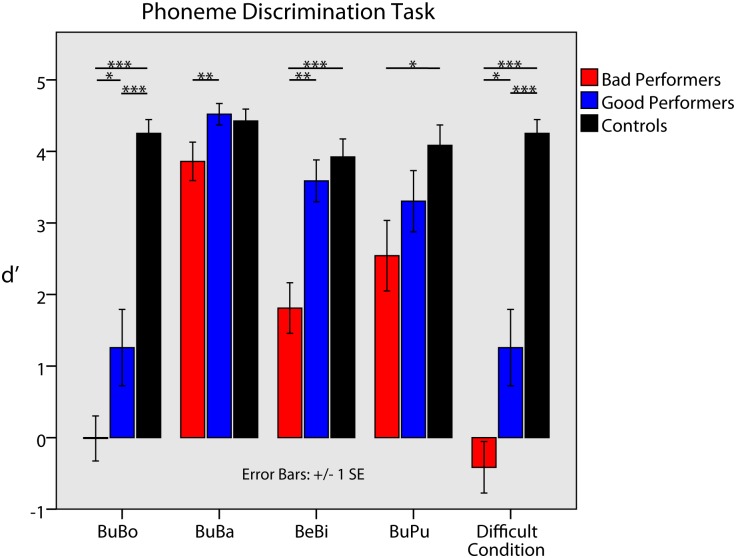
Fig 1. Performance in the phoneme discrimination test displayed for each subtest and all groups.
While good performers achieved d’ scores that were close to the typical hearing control group (3 out of 4 subtests), poor performers showed significantly worse phoneme discrimination abilities than the good performers (3 out of 4 subtests). As intended, this changed when phoneme pairs were sorted for each participant’s most difficult condition. Here, good performers performed significantly worse than the control group and better than the poor performers, who only achieved a guessing level. T-values ranged from 1.7 to 15.21 with p-values from 0.05 (marked by an asterisk) to ≤ 0.01 (marked by two or more asterisks).

