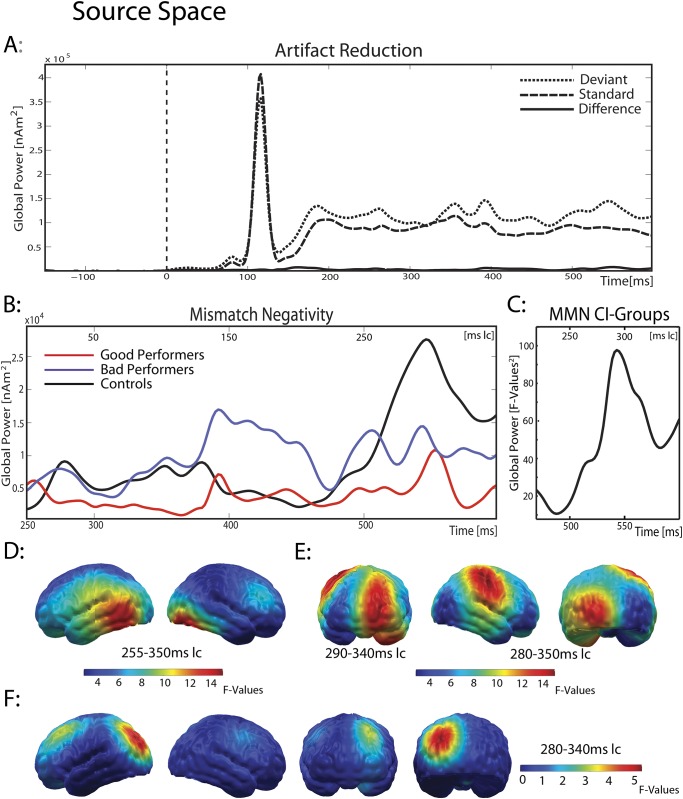
Fig 3. MMN in source space.
(A) global power plot for minimum norm estimates of the CI group, separately displayed for deviants, standards and their difference (MMN). The artifact is clearly visible in standards and deviants from 100 to 130 ms, but–as in sensor space–not in their difference waveform. (B) Global power plot of the difference waveform for all three groups and (C) averaged across both CI groups, with a focus on the MMN time window. (D/E) Topographic map of the MMN in the control group and (D) averaged for both CI groups (E). While the control group showed a bilateral MMN in temporal and supramarginal regions, CI users engaged not only auditory, but also frontal and occipital regions during MMN. (F) Poor performers showed (a trend) for significantly higher activity in the left occipital cortex during MMN.

