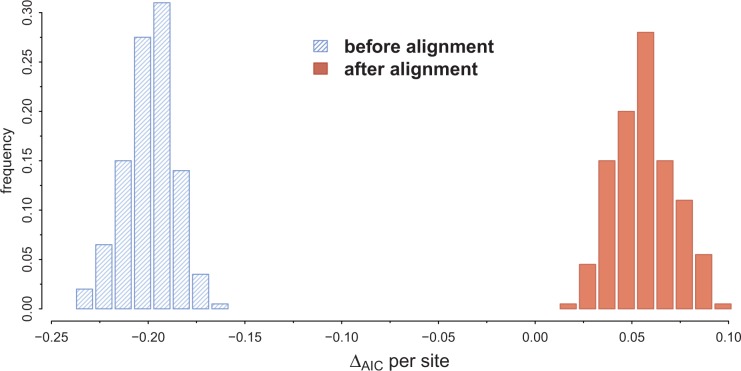
Figure 2.
Data set simulations under IO before and after optimizing the alignment, where positive values for ΔAIC suggest a UCA. It shows ΔAIC per site for data sets simulated under the best model and parameters according to the original study (rtREV + GF). The simulated data sets have 6591 sites before optimizing the alignment, and for each parameter set we simulated 200 replicates. All replicates favor IO before aligning the sequences, but then spuriously favor UCA after the alignment step.

