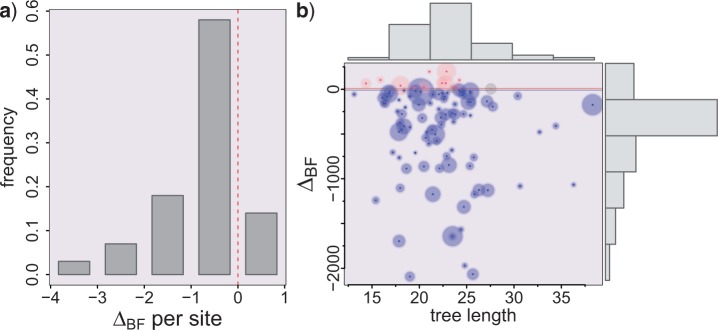
Figure 3.
Bali-Phy results for IO simulated data sets. a) Histogram of the log Bayes factor values per site as calculated by ΔBF divided by the posterior median of the alignment length for the BE data set. b) Unscaled ΔBF against posterior median estimate of tree length under the UCA hypothesis, for 100 replicates. The circle diameter represents the posterior median alignment length for the BE data set, going from 506 to 868 sites. The 12 data sets shown at the top wrongly support UCA, whereas the gray circles near zero are two inconclusive simulations, assuming that more than 10 BF units between the hypotheses corresponds to strong evidence. The correctly identified IO data sets are shown at the bottom part, below -10 BF units.

