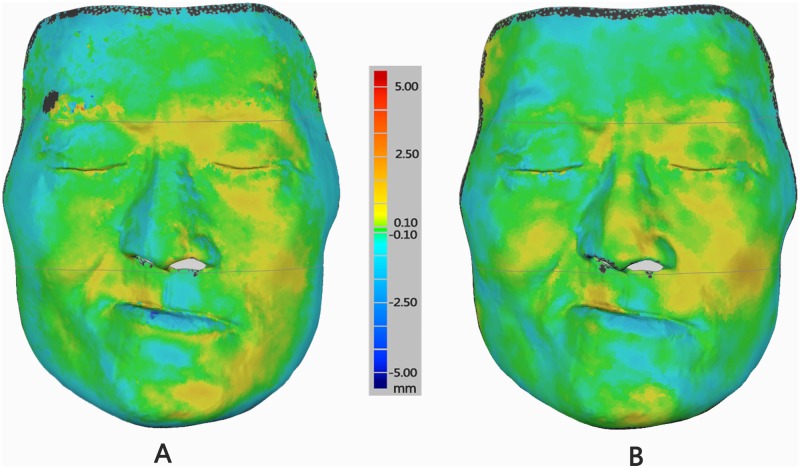
Fig 3. Difference color images of deviation between test and reference scanners for a maxillary defects patient.
Difference color map is set from -5 mm to +5 mm. Yellow to red color indicates positive deviations, blue color shows negative deviation, green color signifies virtually zero error between two superimposed models. The black color shows the deviation out of 5 mm or -5 mm that would not be included in the calculation. (A) Difference color image of deviation between 3dMD (Test) and Faro (Ref) models; (B) Difference color image of deviation between FaceScan (Test) and Faro (Ref) models.

