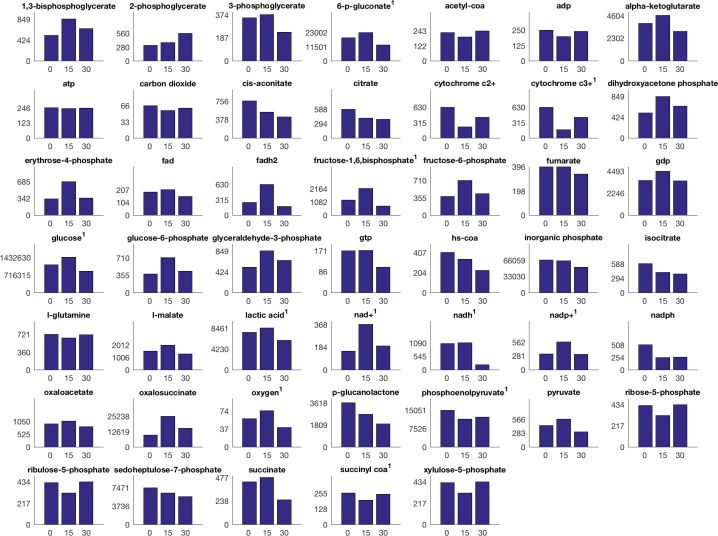
Fig 2. Median metabolite LC-MS intensities over time and experimental group.
Colors indicate sample time, from left to right in the group 0,15, and 30 minutes. Superscript numbers indicate the probability of no difference between population means is less than or equal to p = 0.15, as calculated by ANOVA. P-values for all metabolites are found in the supplementary material (S2). All intensities scaled by 0.001 for ease of display.

