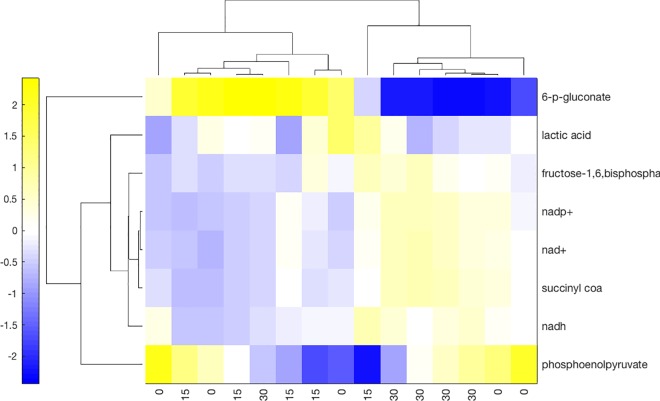
Fig 4. Metabolism Synchronization.
Intensities of metabolites that changed significantly over time as indicated by ANOVA were used to cluster the samples. The distance between the samples is the correlation of their intensities. This distance was then used to cluster rows (intensity of a single metabolite over all samples) and columns (intensity of all metabolites belonging to a single sample). While the 15 and 0 minute samples have similarities, all but one of the 30 minute samples cluster together, indicating more similarity within 30 minute samples than to any other group. The intensities have been standarized by column.

