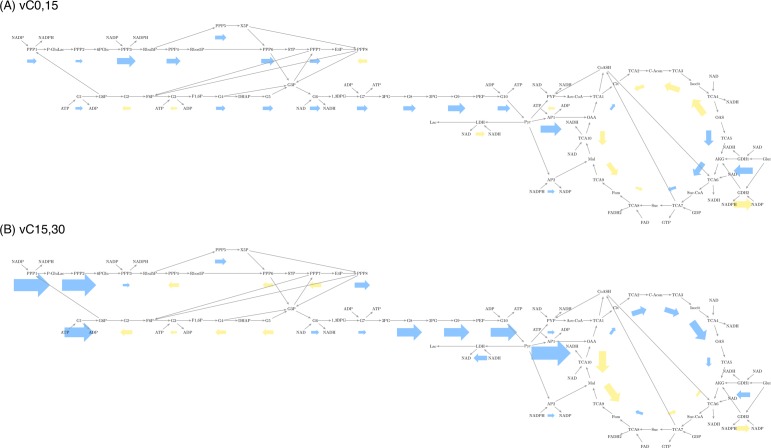
Fig 5. Experimentally-derived flux profiles for compressed chondrocytes display both similarities and differences to hypothetical predictions.
Fluxes calculated for compressed cells for time intervals (A) 0 to 15 min. and (B) 15 to 30 min using the collagen synthesis reaction as described in the text. Similarities (in comparison to predictions in Fig 3A) include large relative fluxes in G1-3 and TCA1-3. Differences include small negative fluxes as discussed in the manuscript. Reactions are represented by labeled boxes connected to substrates by incoming dark gray arrows and to products by outgoing dark gray arrows. Reaction fluxes are represented by arrows colored to match either positive (blue) or negative (yellow) flux. Larger arrows represent larger flux with linear scaling. Negative flux indicates a reversible reaction running in the direction opposite to the direction specified in the stoichiometric matrix. Electron transport chain and synthesis reactions not shown for figure simplicity.

