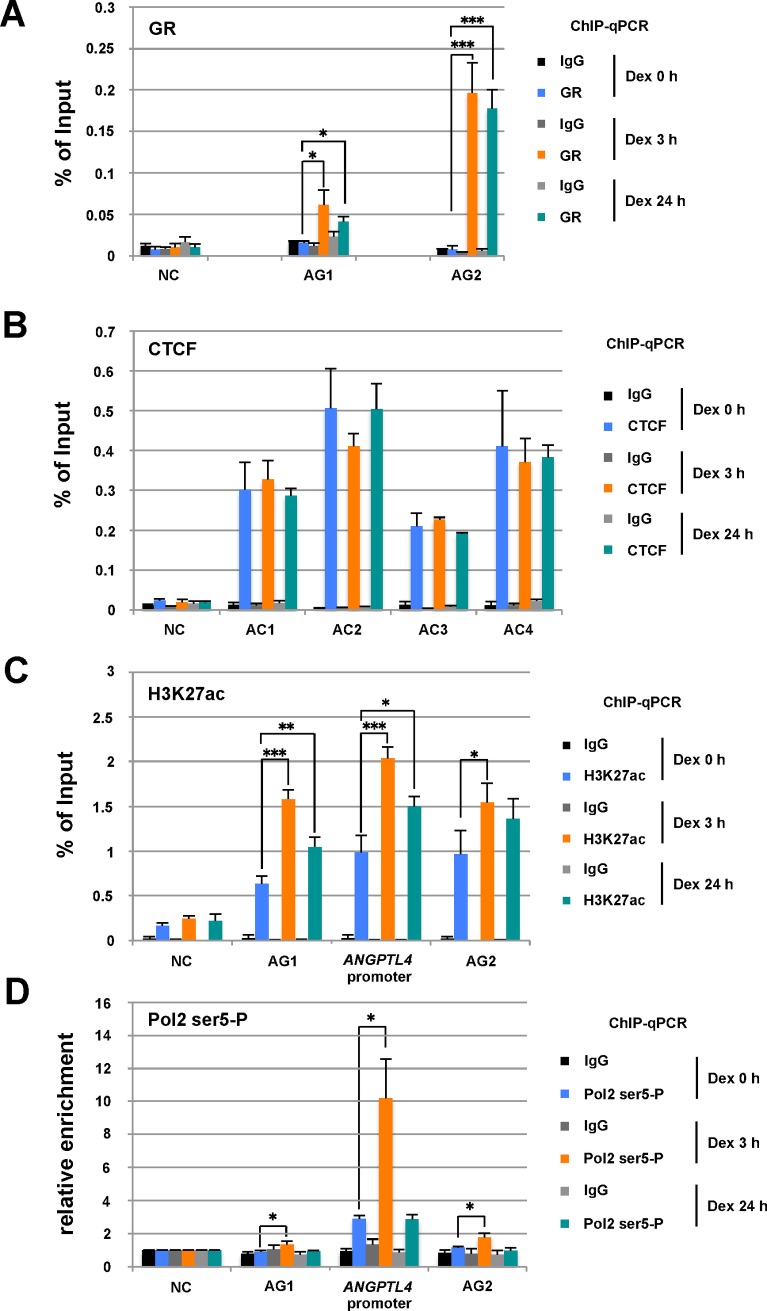
Fig 2. Enrichment of GR, CTCF, acetyl-H3K27, and RNA polymerase II at the ANGPTL4 gene locus in cells treated with Dex.
(A) Enrichment of glucocorticoid receptor (GR) in cells treated with Dex. As shown in Fig 1B, HepG2 cells were treated with Dex for 24 h. ChIP-qPCR analysis was performed using an anti-GR antibody and an anti-rabbit IgG (control), followed by quantitative PCR using specific primers for each AG site and the control (NC). (B–D) Enrichment of CTCF, acetyl-H3K27 (H3K27ac), and active RNA polymerase II (Pol2 ser5-P) in cells treated with Dex. ChIP-qPCR analyses were performed using an anti-CTCF antibody and an anti-rabbit IgG (control) (B), anti-H3K27ac (C), and anti-Pol2 ser5-P (D), followed by quantitative PCR using specific primers for each indicated site. Relative enrichment of the control (NC) site was normalized to 1 (D). Asterisks indicate statistically significance between control (Dex 0 h) and Dex-treated cells at each time point. *P < 0.05, **P < 0.01, ***P < 0.005.

