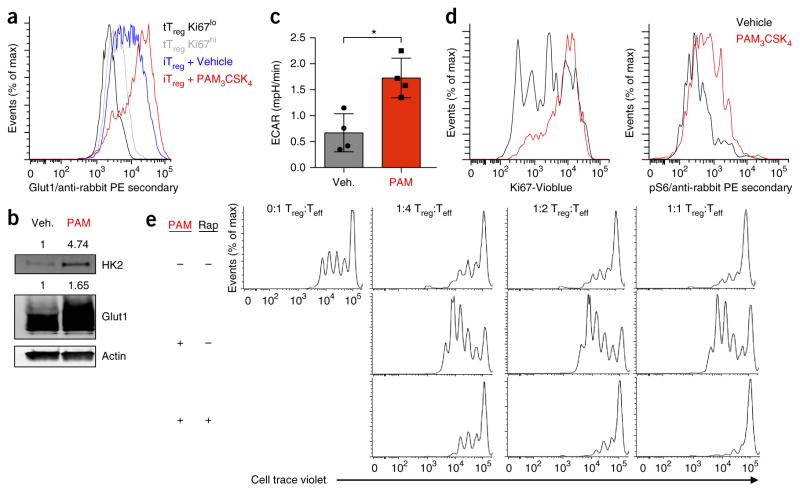
Figure 2.
Signaling via TLR1 and TLR2 drives Treg cell glycolysis and proliferation, yet reduces suppressive capacity. (a) Glut1 expression (as in Fig. 1) of Ki67high and Ki67low tTreg cells derived from the spleens of wild-type mice an of iTreg cells derived from CD4+CD25− T cells isolated from the spleens of wild-type mice and polarized for 5 d under Treg cell–skewing conditions and treated with H2O vehicle (Veh) or Pam3CSK4 (PAM; 5 μg/ml) for the final 24 h. (b) Immunoblot analysis of HK2, Glut1 and actin (loading control) in iTreg cells as in a. (c,d) ECAR of vehicle or Pam3CSK4 treated iTreg (c), and Ki67 expression and phosphorylated S6, determined by flow cytometry (d), in iTreg cells as in a. (e) Inhibition of the proliferation of Teff cells by Treg cells treated for 24 h with DMSO (vehicle (−)) or 20 nM rapamycin (Rap) along with Pam3CSK4 (5 μg/ml) (left margin), then repurified by magnetic selection and functionally assessed an in vitro suppression assay with various ratios (above plots) of Treg cells to Teff cells. *P < 0.05 (Two-tailed Student’s t-test). Data are representative of three independent experiments (a,b,d,e) or two independent experiments with four technical replicates per group (c; mean + s.d.).

