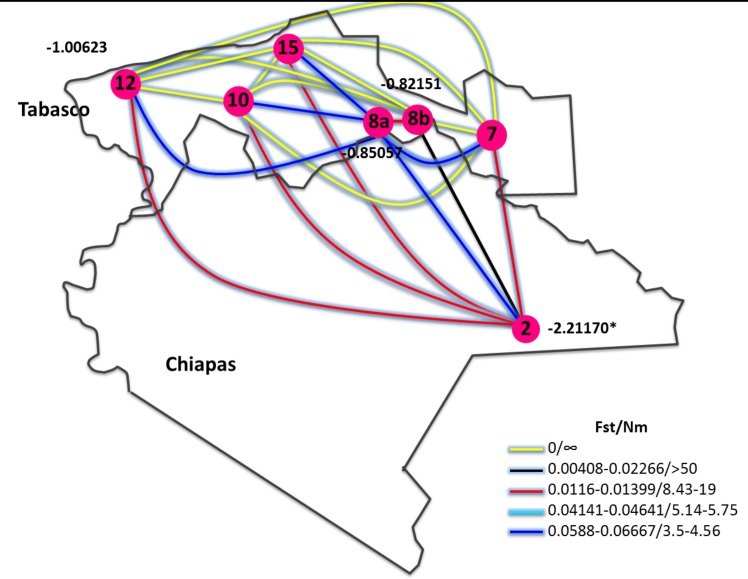
Fig 3. Schematic representation of interactions among population indexes.
The gene flow (Nm), genetic differentiation index (FST), and Tajima’s D values of Blastocystis ST by SSUrDNA analysis, according to different sampling sites; only those sites in which there were enough infected howlers to obtain the indexes are shown. The number together the sampling size circle, mean the Tajima’s D value. * p<0.01

