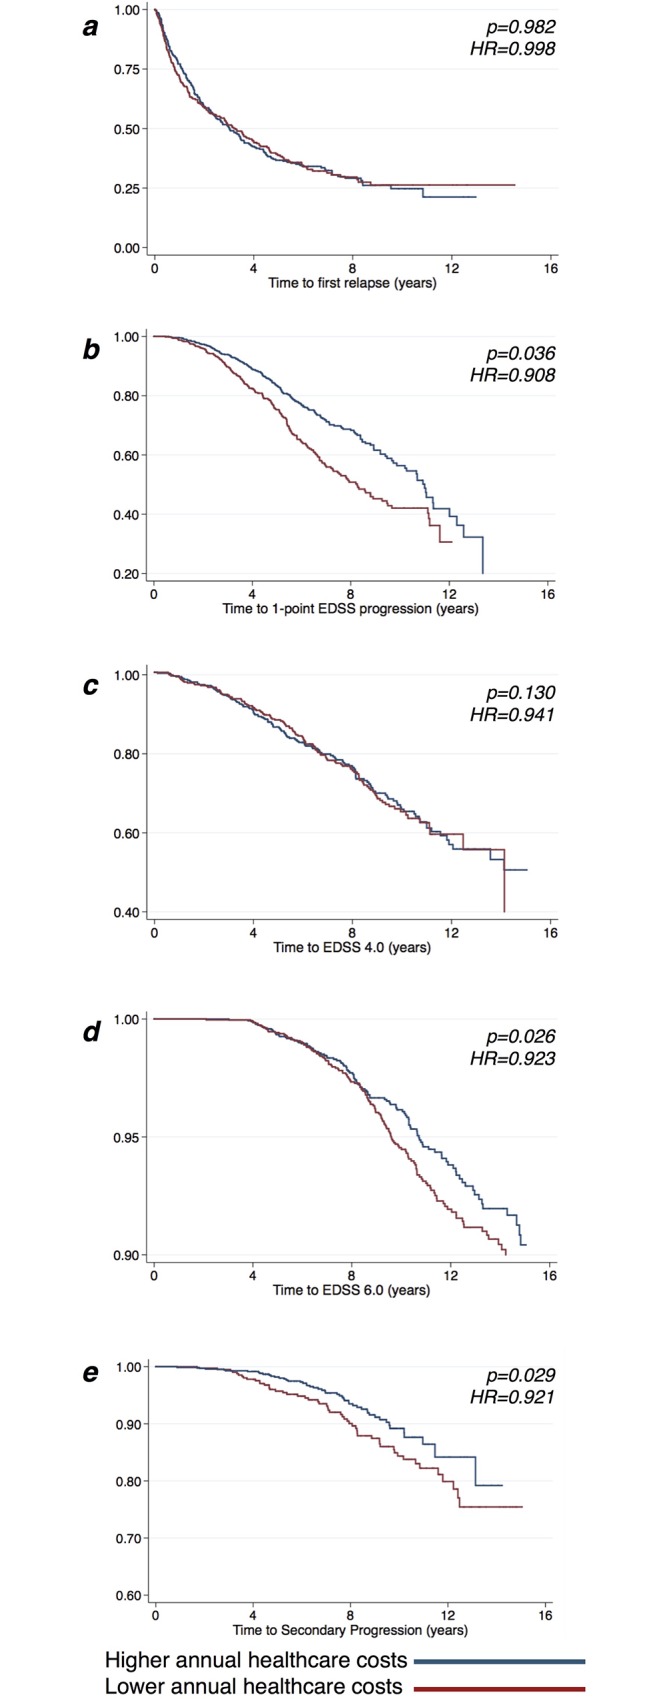
Fig 2. Kaplan-Meier curves for the probability of relapse occurrence, of 1-point EDSS progression, of reaching of EDSS 4.0, of reaching of EDSS 6.0, and of SP conversion, in relation to annual healthcare costs before the specific study endpoint was reached.

Kaplan-Meier plots estimating the probability of relapse occurrence (A), of experiencing 1-point EDSS progression (B), of reaching of EDSS 4.0 (C), of reaching of EDSS 6.0 (D), and of SP conversion (E), in relation to the annual healthcare costs before the specific study endpoint was reached. P-values and hazard ratios (HR) are shown from time varying Cox regression models. For graphical purposes, healthcare costs have been categorized on the median value (the red line represents costs lower than the median value, whereas the blue line represents costs higher than the median value). EDSS: Expanded Disability Status Scale; HR: Hazard Ratio.
