Figure 2.

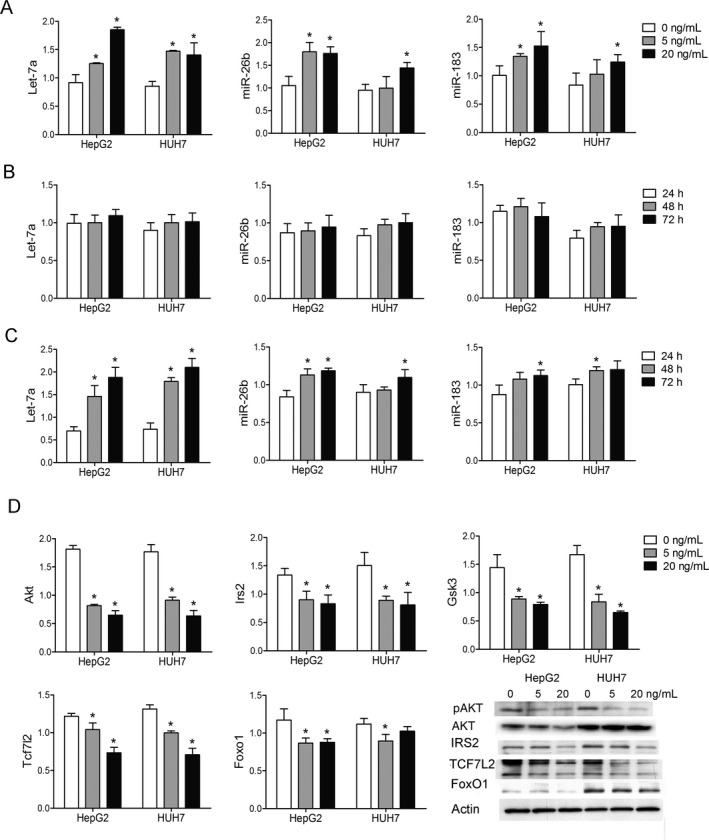
TAC‐induced dysregulation of mi RNA s and their potential targets. (A) The expressions of let‐7a, miR‐26b, and miR‐183 were significantly increased after different concentrations of TAC treatment (5 or 20 ng/mL vs. 0 ng/mL). (B) The expressions of let‐7a, miR‐26b, and miR‐183 did not significantly change after different culture times (48 or 72 h vs. 24 h) in physiological concentrations of TAC treatment (5 ng/mL). (C) The expressions of let‐7a, miR‐26b, and miR‐183 were increased in a time‐related manner (48 or 72 h vs. 24 h) in extremely high concentrations of TAC treatment (20 ng/mL). (D) The selected glucose metabolism‐associated targets (Akt, Irs2, Gsk3, Tcf7l2, and Foxo1) of let‐7, miR‐26b, and miR‐183 were significantly decreased after TAC treatment. The protein content of p‐AKT, AKT, IRS2, TCF7L2, and FoxO1 decreased after TAC treatment. HepG2 and HUH7 cells were seeded at 2.5 × 10⁵ cells per well in six‐well plates and treated with different concentrations of TAC (0, 5, or 20 ng/mL). Protein was extracted after 72 h of culture. *p < 0.05 versus control group. TAC, tacrolimus; miRNA, microRNA.
