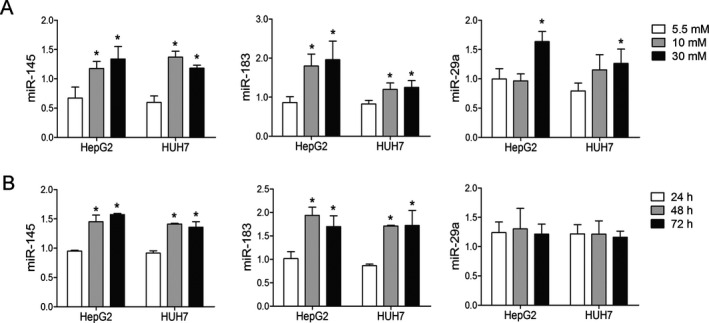
Figure 3.

High glucose led to changed mi RNA levels in a dose‐ and time‐dependent manner. (A) The expressions of miR‐145, miR‐183, and miR‐29a significantly increased after high‐glucose culture. HepG2 and HUH7 cells were seeded at 2.5 × 10⁵ cells per well in six‐well plates and treated with different concentrations of glucose (5.5, 10, or 30 mM). (B) The expressions of miR‐145 and miR‐183 elevated in a time‐dependent manner when cultured with 10 mM of glucose. RNA was extracted after 24, 48, and 72 h of culture. *p < 0.05 versus control group. miRNA, microRNA.
