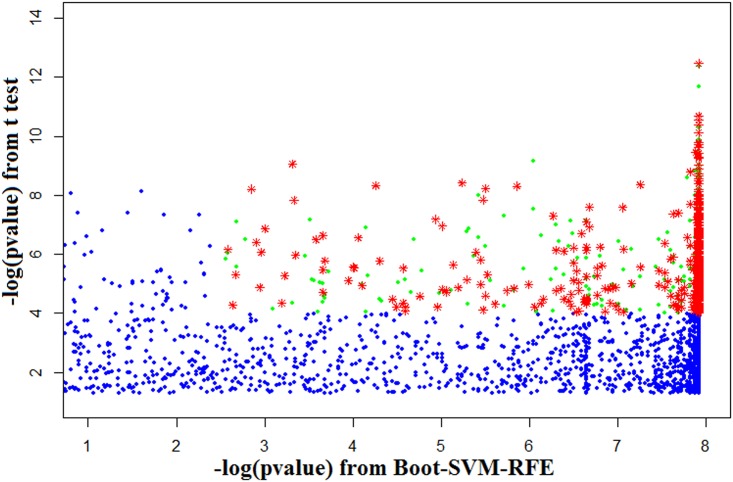
Fig 1. Gene selection plot for selection of informative genes for Al stress in soybean.
The horizontal axis represents negative logarithm of statistical significance values obtained from Boot-SVM-RFE. The vertical axis shows the negative logarithm of statistical significance values from t-test. Green dots indicate selected probes with–log (p-value) from Boot-SVM-RFE ≥ threshold of 2.5 and t-test–log (p-value) ≥ threshold of 4. Red stars indicate the selected probes which have Arabidopsis orthologs. Blue dots indicate unselected probes.

