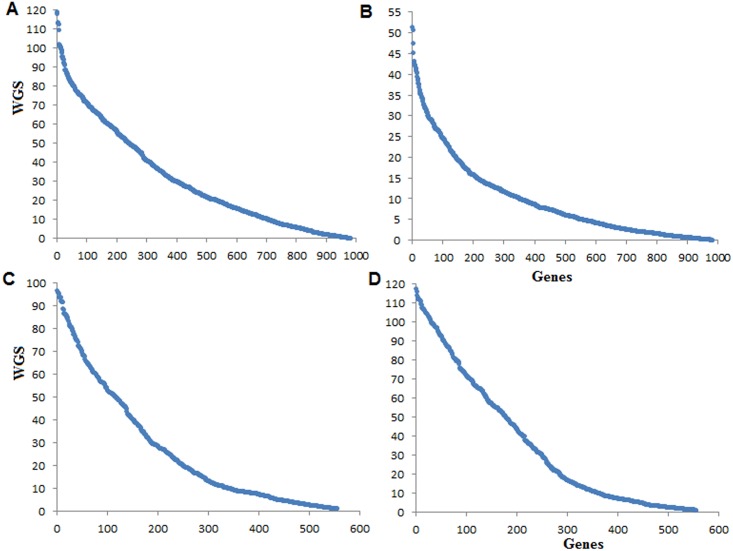
Fig 5. Distribution of WGS in complete networks under stress and control conditions.
The distributions of WGS of genes in GCNs for Al stress (A) and control (B) conditions in soybean are shown. The distributions of WGS of genes in GCNs for salinity stress (C) and control (D) conditions in rice are shown. For all these cases, the distributions are heavy tailed.

