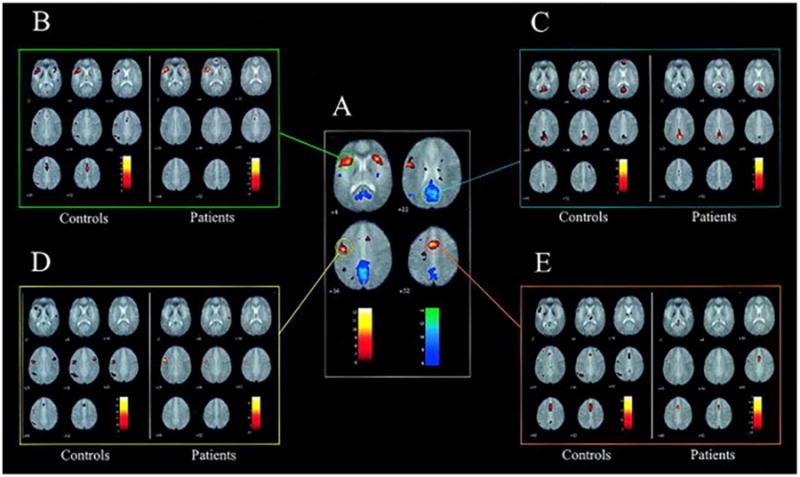
Figure 2.

Connectivity maps of controls and patients with left temporal lobe epilepsy (TLE) for four seed regions. (A) Brain activity during the language production in a group of 30 healthy controls. Results are overlaid onto the mean echo planar imaging of the 30 subjects (activation in red-yellow, deactivation in blue-white). Group analysis is performed using a mixed effects model and thresholded at p value less than 0.05, corrected for multiple comparisons. The approximate locations of the four seed regions are shown as colored rings: anterior cingulate cortex (ACC) (red), posterior cingulate cortex (PCC) (blue), left IFG (green), and left middle frontal gyrus (MFG) (yellow). (B–E) The results of performing functional connectivity analysis on a separate cohort of 8 healthy controls (left panels), together with a group of 17 patients with left TLE (right panels). Regions functionally connected (correlated) with the ROI average signal time course in the left IFG (B), PCC (C), left MFG (D) and ACC (E).
