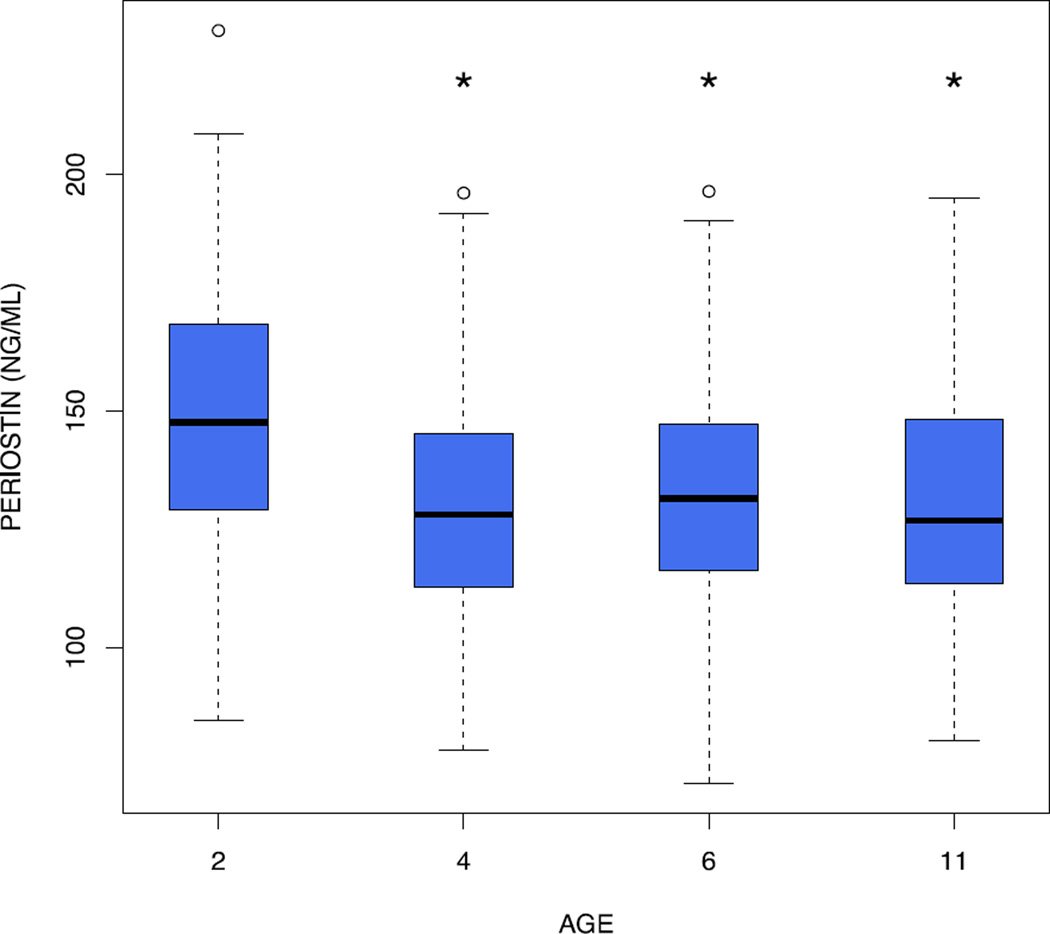
Figure 1.
Serum periostin decreases with age. The shaded boxes represent the interquartile range; the black horizontal line represents the median. The whiskers represent the minimum and maximum of all data, with the exception of outliers, which are denoted by a small round circle. The * above age 4, 6 and 11 years denotes a statistically significant difference compared to age 2 years.

