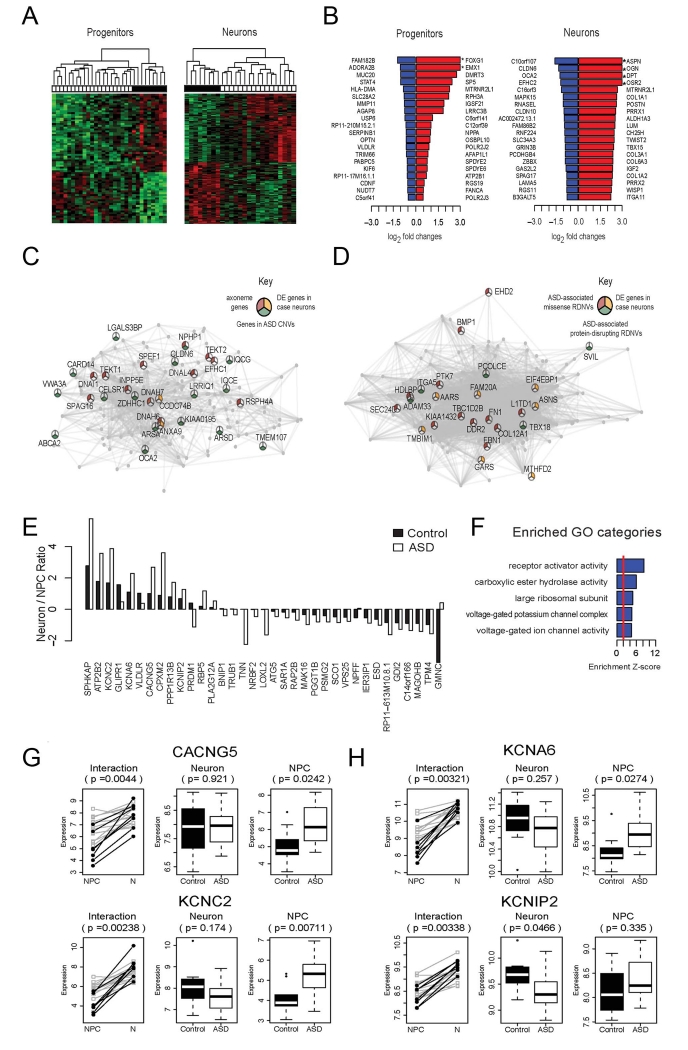
Figure 5.
Gene expression changes in neurons and NPCs derived from idiopathic ASD Individuals with macrencephaly. (A) Hierarchical clustering using the differentially expressed (DE) genes identified in NPCs (left) and neurons (right). The heatmap shows color-coded scaled expression values, up-regulation in red and down-regulation in green. Each column represents a line from an iPSC clone. The horizontal bar on the top shows disease status: white cell lines are derived from ASD cases, and black represents cell lines from controls. (B) Log2 transformed fold changes of the top 20 down-regulated (blue) and top 20 up-regulated (red) genes in patient neural progenitors (left) and neurons (right) as compared to controls. Genes highlighted with * have log2 fold change > 3. (C) Visualization of the top connections in the brown module, which is down-regulated in ASD neurons. Genes are connected if their pairwise correlation is larger than 0.8. Pie chart: genes in GO category “axoneme” (red); genes in ASD CNVs (yellow); differentially expressed genes (p<0.005)(green). (D) Visualization of the top connections in the tan module, which shows up-regulation in ASD neurons. Genes are connected if their pairwise correlation is larger than 0.8. Pie chart: genes that are previously identified to be affected by ASD-associated missense (red) and protein disrupting (green) rare de novo variation (RDNVs), and differentially expressed genes (p<0.005) (yellow). (E) Barplot showing the ratios of neuronal/progenitor expression of the DE genes in the progenitor to neuron transition. Black bars represent the ratios in control samples, and white bars represent the ratios in ASD samples. (F) The top 5 enriched GO categories among the genes showing differentiation-dependent expression changes in ASD Individuals vs. controls. (G and H) Dynamic expression patterns (log2 transformed read counts) of the genes that show significant differentiation-dependent expression alterations during neuronal differentiation (p<0.005) and that are in the GO category “voltage gated ion channel activity.” White: cell samples derived from ASD individuals; black: cell samples from controls. P-value in the interaction plot shows the significance of the interaction effect between cell type and disease status. P-values in the neuronal and progenitor plots represent the significance of the difference between ASD cases vs. controls.

