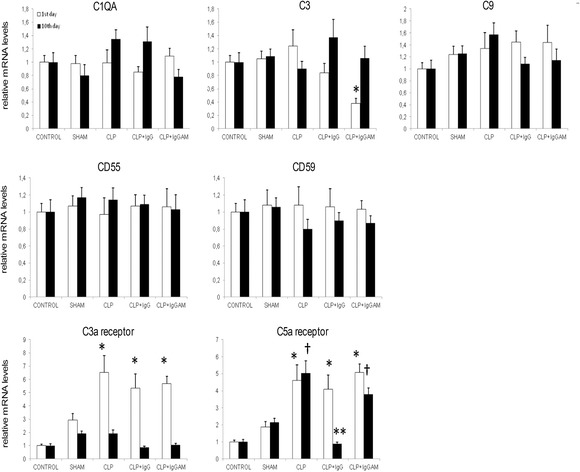
Fig. 1.

Brain mRNA expression levels of complement factors, complement inhibitors, and complement receptors evaluated by real-time PCR and expressed as fold changes relative to the control group. *† p < 0.05; **p < 0.01. In the C3 panel, * denotes significant differences between the CLP + IgGAM group vs the other groups; in the C3a receptor and C5a receptor panels, * denotes significant differences between the CLP, CLP + IgG, and CLP + IgGAM groups vs the control and sham groups; and in the C5a receptor panel, † denotes significant differences between CLP and CLP-IgGAM groups vs the control and sham groups, and ** denotes significant differences between the CLP-IgG group vs the CLP and CLP-IgGAM groups. Vertical bars indicate standard deviations
