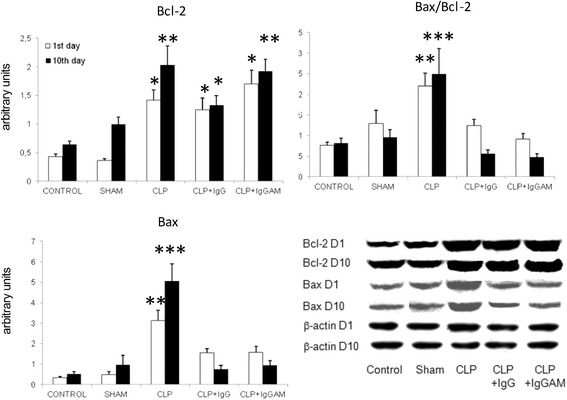
Fig. 4.

Brain expression levels of Bax, Bcl-2, and Bax/Bcl-2 ratios evaluated by immunoblotting, quantified by measuring band intensity with ImageJ, normalized by β-actin expression, and expressed as arbitrary units. *p < 0.05; **p < 0.01; ***p < 0.001. In the Bcl-2 panel, the asterisks denote significant differences between CLP, CLP-IgG, and CLP-IgGAM groups vs the control and sham groups; in the Bax and Bax/Bcl-2 panels, the asterisks denote significant differences between the CLP group vs the other groups. Vertical bars indicate standard deviations. Lower panel shows representative immunoblotting bands for each group and time point
