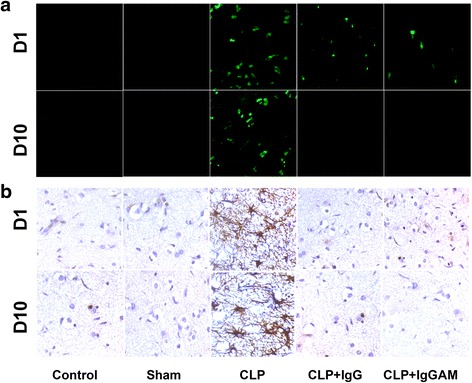
Fig. 5.

Representative immunofluorescence (a) and immunohistochemistry (b) images demonstrating the apoptosis (evaluated by TUNEL staining, a) and gliosis (evaluated by glial fibrillary acidic protein antibody staining, b) status of different treatment arms at day 1 (D1) and day 10 (D10) of the experiment. Each section roughly corresponds to the same cerebral cortex region (original magnification ×100)
