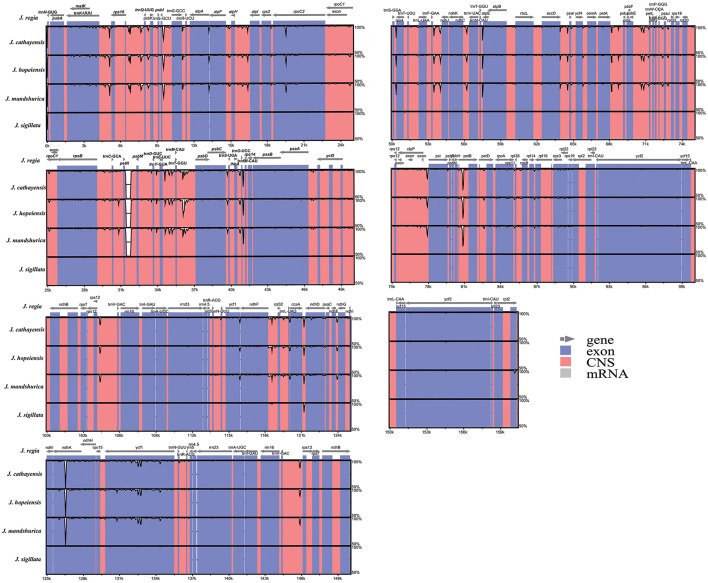
Figure 3.
Sequence identity plot comparing the five Juglans chloroplast genomes with J. regia as a reference by using mVISTA. Vertical scale indicates the percentage of identity ranging from 50 to 100%. Coding regions are marked in blue and non-coding regions are marked in red. Gray arrows indicate the position and direction of each gene.

