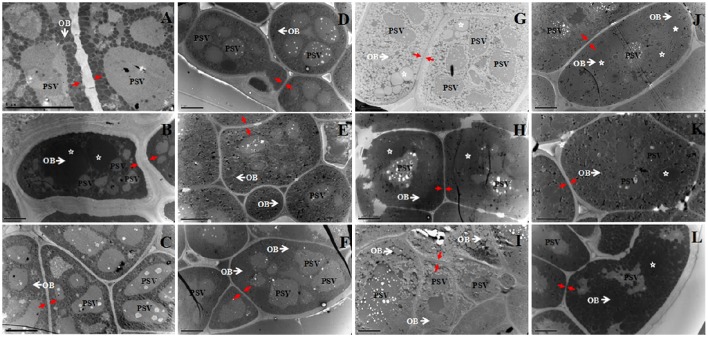
Figure 1.
TEM analysis of the cotyledon cells of 12 rapeseed materials with different oil content. (A), 12QT329; (B), 10QT0073; (C), 13123F; (D), 12QT127; (E), 09QT68; (F), 09QTL1; (G), 14313; (H), 11DH623; (I), 14309; (J), TGY8; (K), TGY10; (L), TGY14; White arrow and OB, oil body; PSV, protein body; Red arrow, cell wall; Star, unusually large OB; Bar, 5 μm.

