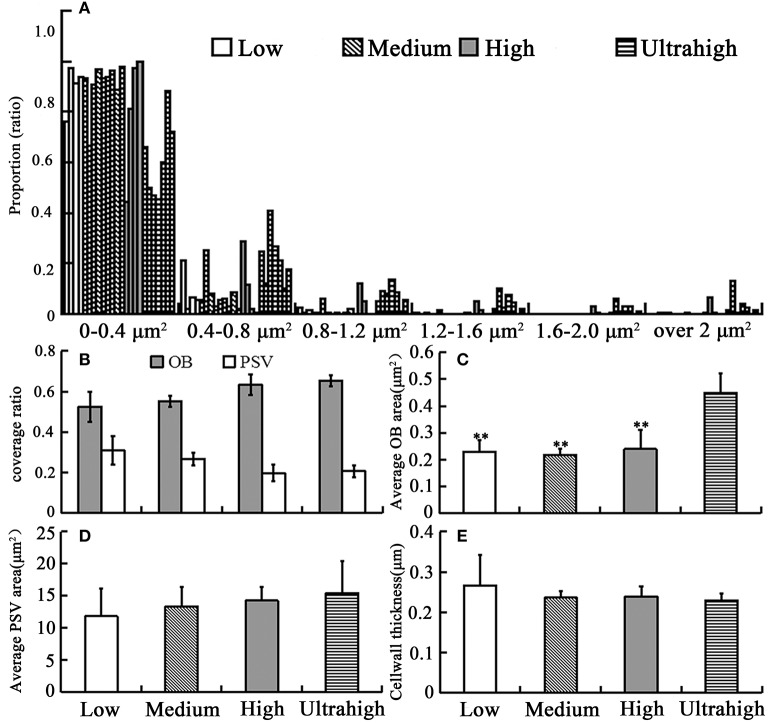
Figure 2.
Statistical analysis results of the related morphology traits in the cotyledon cells of several B. napus materials with large difference in oil content. (A) histogram distribution of OB size of all materials; (B) the coverage of OB and PSV; (C) the average cross-sectional area of OB; (D) the average size of PSV; (E) cell wall thickness. At least three repeats for each set of data. Bar means SE. **Significant difference (p < 0.01).

