Figure 5.
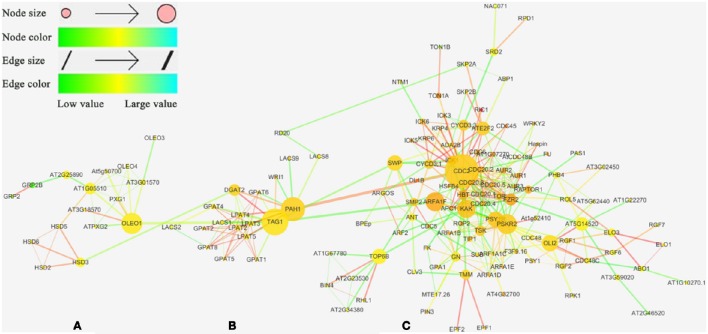
The interaction network of candidate genes. Network visualization for interaction of the 201 candidate genes observed from the QTL results using Cytoscape_V3.2.0 software. Genes are presented as nodes and gene interactions are presented as edges. (A) OB-membrane-related genes cluster. Different classification genes indicated by different shape with different color (red round rectangle, OB-membrane-related gene; yellow ellipse, TAG metabolism-related gene; blue diamond, cell process-related gene). (B) TAG metabolism-related genes cluster. (C) cell process-related genes cluster.

